Read the chart
Name the pattern
From your first doji to triangles, flags and head and shoulders.
128 patterns · 21 quizzes · Two ways to play
New to candlesticks? Start here
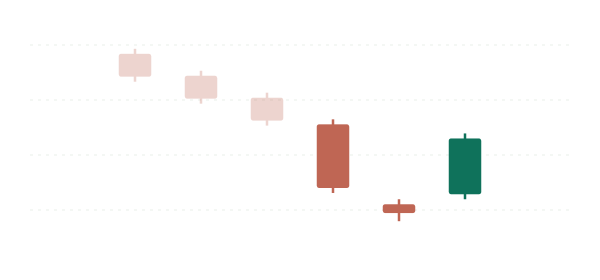
Each candle shows an open, high, low and close. A solid green body means the close is above the open; a solid red body means it is below. The thin lines (wicks) show the high and low. Read candles from left to right.
Name the full-colour candles. Wider chart patterns use a price line with dashed guides; follow the complete formation. Faded candles show the preceding trend. Shape and context both matter: a hammer and a hanging man have the same shape, but different preceding trends.
Answers ignore capital letters, spaces and punctuation. Include “bullish” or “bearish” where needed. Common alternative names are accepted. Multiple choice is the default, with four options per question. Choose Legendary mode to type each pattern name from memory. Best scores are kept separately for each mode. Each question has one scored attempt; skipping reveals the answer.
These are simplified learning diagrams, not price forecasts or trading recommendations. Pattern reference: StockCharts ChartSchool ↗
The collection covers all 104 entries in the CandleScanner catalogue plus 24 wider chart patterns. Traditional “white” and “black” candle names appear as green and red here. Basic-candle questions use a typical-body size guide. Some formations overlap; use the most specific name for the full-colour candles and the stated context. Naming conventions vary between references.
Make the most of each practice round
Start with the first level in multiple-choice mode. Look at the full-colour formation, choose the most specific name you recognise, then read the explanation after your attempt. The faded candles provide context; they are not the formation you are being asked to name.
For a missed answer, compare the explanation with the drawing before moving on. At the end of the round, open the pattern review to revisit the diagram and your answer together. Repeat the level, then try Legendary mode when you can name the shapes without the four options. Each mode keeps a separate best score.
The drawings are original, simplified examples built from illustrative price values. They are not live market charts, backtests or evidence that a pattern predicts the next price move. The references above explain the naming conventions; the quiz gives you a way to practise recognising them.
Best scores are saved on this browser. See how quiz storage and sharing work. Question coverage and practice flow checked on .